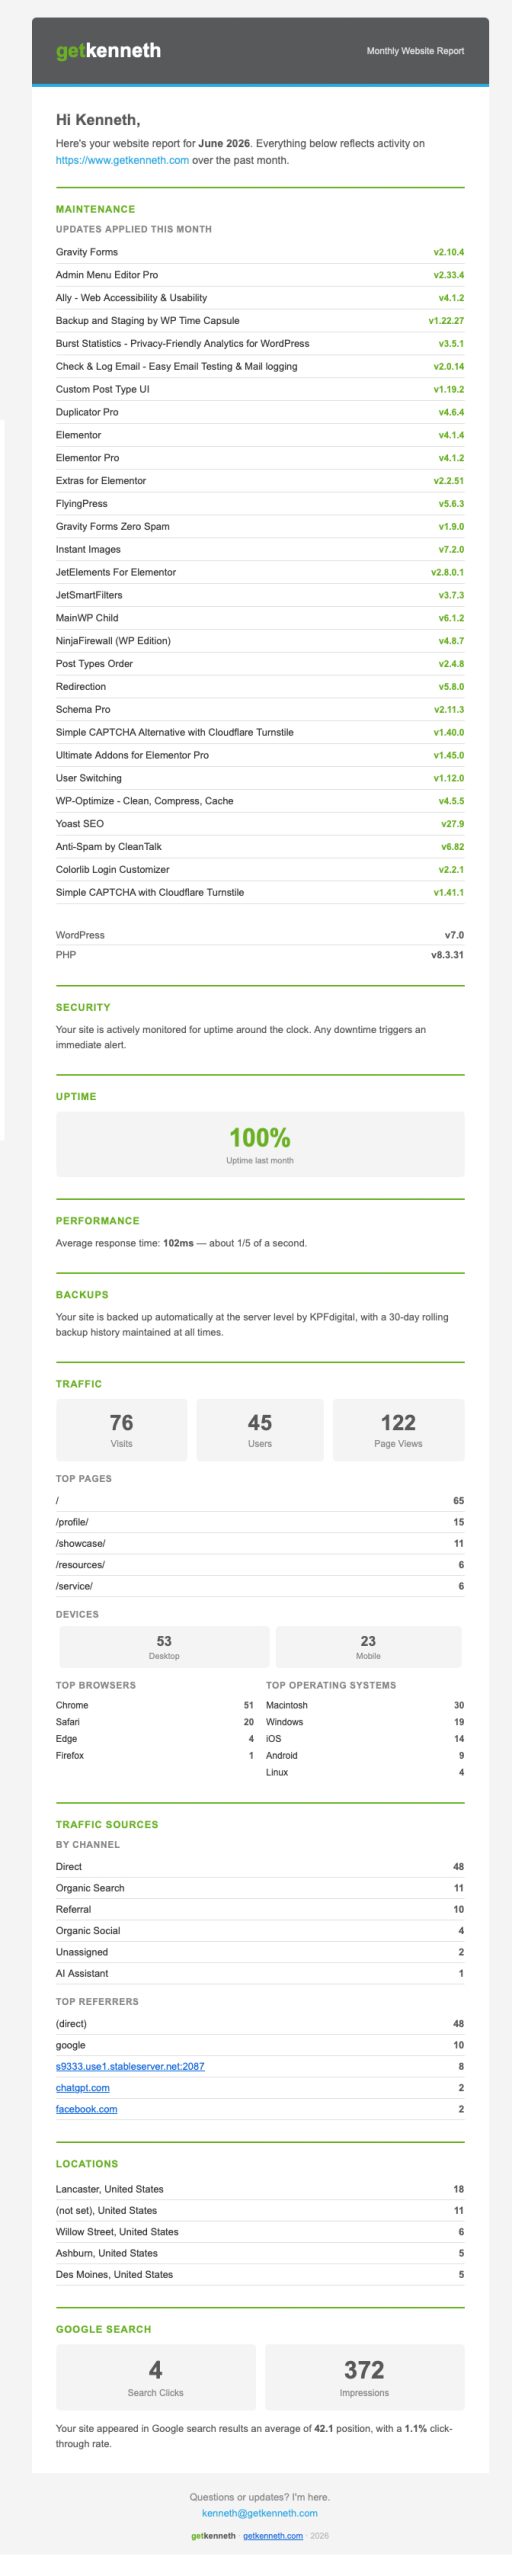
A monthly snapshot of what’s happening on your website — uptime, performance, traffic, and search visibility. This page explains what each section means and what to do if something looks off.
Shows the current versions of WordPress and PHP running on your site. I keep these up to date as part of ongoing care — newer versions mean better security and performance.
Your site is actively monitored around the clock. This section confirms that monitoring is in place and running.
The percentage of time your site was online and reachable last month. 100% is the goal. Anything below 99% is worth a conversation — though brief dips can happen for reasons outside either of our control (server maintenance, DNS propagation, etc.).
Average server response time for the month. Under 200ms is healthy; under 100ms is excellent. This measures how quickly your server responds to a request — not how fast the page fully loads in a browser, which involves more variables.
Confirms that automated backups are running. Your site is backed up at the server level on a rolling 30-day basis.
Sessions (visits), users, and pageviews from Google Analytics for the previous month, along with your top pages by traffic.
A note on traffic numbers: low numbers don’t automatically mean something is wrong. Many business websites serve a small, specific audience — a few dozen visits from the right people matters more than thousands of unqualified ones. If your traffic looks low and you’d like to understand why, or explore ways to grow it, that’s a good conversation to have.
Shows what your visitors are using to access your site. Useful for knowing where to focus design and compatibility attention.
Where your visitors came from — direct (typed your URL or bookmarked it), organic search (found you on Google), social, referral (another site linked to you), and so on. This gives a picture of which channels are actually driving people to your site.
Top cities and countries your visitors came from last month.
Data from Google Search Console — how many times your site appeared in search results (impressions), how many people clicked through (clicks), your average position in results, and your click-through rate.
Position numbers here can look surprising — a position of 20 or 35 doesn’t mean something is broken, it means your site is appearing in search results but not yet on page one for those queries. Improving this is something we can work on together if it’s a priority.
Reply to your monthly report email directly — it comes to me personally. If a number looks wrong, missing, or concerning, I want to know about it.
The report shows you where things stand. If it sparks any ideas — more traffic, a site refresh, a new feature, better search visibility — I’m straightforward about what’s realistic, what it takes, and whether it’s worth doing for your specific situation.
Schedule a free 20-minute call — or just reply to your report.